PM2.5 in household kitchens of Bhaktapur, Nepal, using four different cooking fuels. Atmos Environ, Apr 29, 2015.
Authors: Amod K. Pokhrel, , Michael N. Bates, Jiwan Acharya, Palle Valentiner-Branth, Ram K. Chandyo, Prakash S. Shrestha, Anil K. Raut, Kirk R. Smith
Highlights
- One of the largest databases of indoor PM2.5 measurements from cookstoves.
- PM2.5 levels were measured in kitchens using low-cost nephelometers.
- The nephelometers results were well correlated with results from gravimetric method.
- Decreasing PM2.5 was associated with biomass, kerosene and then LPG/electric stoves.
- PM2.5 levels in the kitchens with electric stoves were similar to ambient PM2.5 levels.
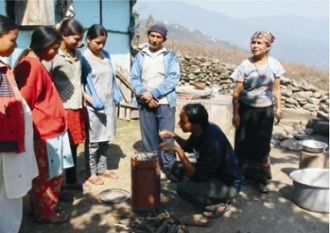
In studies examining the health effects of household air pollution (HAP), lack of affordable monitoring devices often precludes collection of actual air pollution data, forcing use of exposure indicators, such as type of cooking fuel used. Among the most important pollutants is fine particulate matter (PM2.5), perhaps the best single indicator of risk from smoke exposure. In this study, for one of the first times at scale, we deployed an affordable and robust device to monitor PM2.5 in 824 households in Bhaktapur, Nepal. Four primary cooking fuels were used in roughly equal proportions in these households: electricity (22%), liquefied petroleum gas (LPG) (29%), kerosene (23%), and biomass (26%). PM2.5 concentrations were measured in the kitchens using a light-scattering nephelometer, the UCB-PATS (University of California, Berkeley-Particle and Temperature monitoring System). The major predictors of PM2.5 concentrations in study households were investigated. The UCB-PATS results were well correlated with the gravimetric results (R2=0.84; for all fuels combined).
The mean household PM2.5 concentrations across all seasons of the year were 656 (standard deviation (SD):924) μg/m3 from biomass; 169 (SD: 207) μg/m3 from kerosene; 101 (SD: 130) μg/m3 from LPG; and 80 (SD: 103) μg/m3 from electric stoves. In the multivariate regression of PM2.5 measures, compared with electric stoves, use of LPG, kerosene and biomass stoves were associated with increased indoor PM2.5 concentrations of 65% (95% CI: 38-95%), 146% (103-200%), and 733% (589-907%), respectively. The UCB-PATS performed well in the field. Biomass fuel stoves without flues were the most significant sources of PM2.5, followed by kerosene and then LPG stoves. Outdoor PM2.5, and season influenced indoor PM2.5 levels. Results support careful use of inexpensive light-scattering monitors for monitoring of HAP in developing countries.