Costs and Service Levels of Water and Sanitation: A Study of Peri-Urban Locations in Andhra Pradesh, 2012.
G. Alivelu, et al. WASHCost (India) Project. CENTRE FOR ECONOMIC AND SOCIAL STUDIES.
The present study’s main objectives are to estimate the cost of service provision across periurban locations for drinking water and sanitation and the relative expenditure on different cost components in reality against the existing norms. Life Cycle Cost Approach (LCCA) is adopted to estimate the actual cost components of service provision. The study is based on the analysis carried out using data collected from 18 peri-urban locations spread over nine agroclimatic zones of AP. The data is collected at two levels. At level one cost data were obtained from 18 municipalities – 2 from each zone. This data is generated from the official records of Public Health and Engineering Department (PHED) at the municipality level. At level two, detailed household level data on socio-economic aspects along with the information pertaining to drinking water and sanitation are gathered from a selected ward from each of the 11 municipalities.
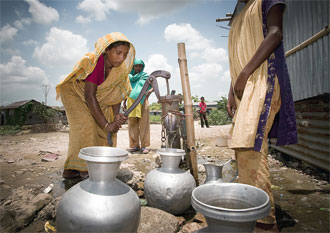
Most of the investments are on capital expenditure on hardware i.e on creation of water and sanitation infrastructure assets. Investment on capital expenditure on software is either absent or negligible. Allocations towards water planning and designing are negligible. At the state level, for water, only 30 percent of the households own tap. During summer, household scored above basic services in terms of quality and reliability while 16 percent of the households scored above basic services in terms of accessibility. In case of quantity, we do not find any households which scored above basic service levels.
As far as sanitation is concerned, households spend more both on construction and also maintenance of toilets. Relative shares of various components indicate that sanitation CapExHard accounts for 60 percent of the cost at the State level while recurrent costs account for 40 percent. The field survey clearly shows that the male members of the household do not use toilets and resort to open defecation. On an average, at the State level, around 39 percent of men and women each use toilets in eleven peri-urban towns, while only 21 per cent of children use toilets. On the sanitation service ladder, all the indicators except access which is scored as basic, at the aggregate level, we observe limited or no service with respect to use, reliability and environmental protection. When service levels are plotted against the unit cost, there appears to be no association between the two. There is no correspondence, especially in the case of use. Reliability is very low. The higher level of environmental protection indicator could be due to other reasons rather than unit costs.